Introduction by Jim Wang, followed by Kyle Nolan’s walkthrough.
Over the years, I’ve seen my fair share of personal finance apps.
The ones that are free tend to be fairly useful but loaded with advertisements or other “features” designed to sell you more stuff. Nothing wrong with that, since the tool is free, but they can be cumbersome.
The ones that are paid tend to be more powerful and depending on what they specialized in, well worth the money.
Today, I want to share with you a paid tool that I found to be both powerful and beautifully designed. It’s called ProjectionLab and it’s exactly what you think it is – a financial planning “simulator” where you can chart your future and consider various scenarios and simulations.
I’ve asked the founder, Kyle, to walk us through the tool because it has layers upon layers of features and I only scratched the surface. Best of all, you can play with the “sandbox” without registering or signing up. Just go to ProjectionLab and click on “Try the Sandbox” on the homepage.
I’ll let Kyle explain more:
Hey everyone, I’m Kyle. I am an engineer from Boston who wasn’t sure where his financial life was headed, and then spent the last two years building a tool to figure it out.
In my early 20s, my plans only looked about as far ahead as when I would have enough saved for another scuba diving trip. At the time I had a nagging feeling there was a lot I didn’t know about finance and investing… and I was right.
But when I finally discovered books and blogs like The Simple Path to Wealth, A Random Walk Down Wall Street, Psychology of Money, Mr. Money Mustache, and Wallet Hacks, it finally clicked that I needed to take control of my financial future.
Instead of just daydreaming about the few weeks a year when I could feel the most alive, I wanted to build a tactical plan for how to eventually feel that way all the time.
So, I went looking for a good long-term planning and forecasting tool. Something modern, fluid, nuanced, that respects your data, and is actually fun to use. Must already exist, right?
After discovering that the answer was more of a “wellll, not exactly…”, I went off the deep end and spent all my free time for the past two years building a new tool instead.
And as you read on, we will use it to walk through some of the Wallet Hack’s essential concepts!
Table of Contents
Watch a Video Walkthrough
If you have 18 minutes, here’s a video walkthrough that goes through everything:
👉 Click here to give ProjectionLab a try
Building a personal finance simulator
It was a classic tale, really: I wanted to plan for a life of freedom. So naturally, I went from working 9 to 5 with a good work-life balance, to working 24/7 with no work-life balance! 😅
But leaving that irony aside, let me introduce ProjectionLab.
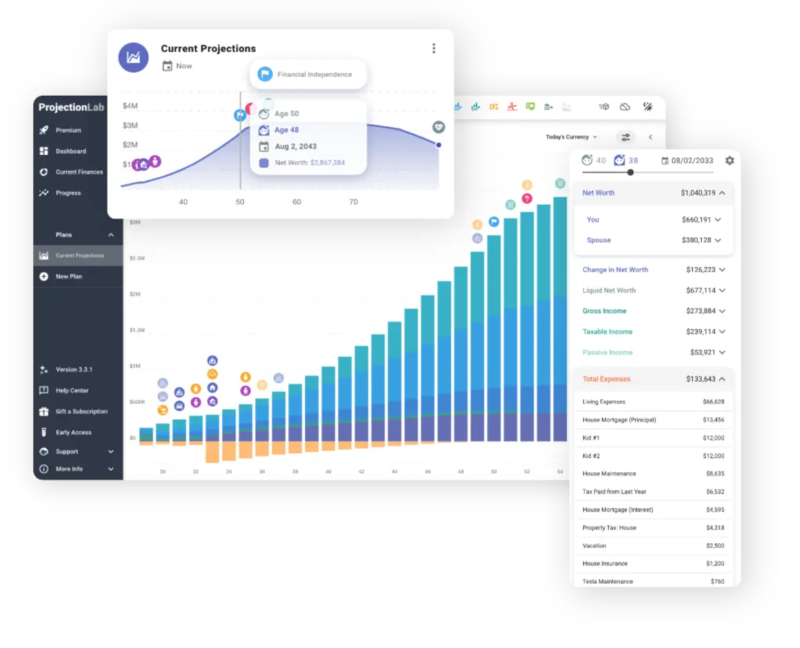
You can create beautiful financial plans with a level of nuance and flexibility that exceeds the standard online retirement calculators, run Monte Carlo simulations, backtest on historical data, review detailed analytics for estimated taxes, plan how to live life on your terms, and with some luck, reduce anxiety around your finances.
There is a free sandbox if you just want to hop in and see how it works. It does not ask to link your financial accounts. You do not have to create an account to try it, and it works pretty well for international scenarios.
It respects your data, and will not try to upsell you on advisory services.
Lifetime users can even self-host ProjectionLab and have their own independent deployment for complete control.
Okay, but what can you do with this?
Here is the TL;DR.
With ProjectionLab, you can:
- Model and simulate your financial future
- Create multiple plans and compare them
- Visualize projected cash-flow with Sankey diagrams
- Review estimated taxes and effective tax brackets for each kind of income
- Backtest on historical data and run Monte Carlo simulations to understand your chance of success
- Create granular models for how you expect accounts/income/expenses/inflation/etc to change over time
- Build dynamic configurations based on goals like achieving financial independence, taking time off for travel, home ownership, or starting a rental empire
- Experiment with Roth Conversions, 72t (SEPP) Distributions, and other advanced strategies
- Model international scenarios
- Track your actual progress over time
- Control where your data is saved, with no link to your real financial accounts
- Self-host your own private deployment if you want
Map out your life
Plans in ProjectionLab are centered around milestones. These are your big picture goals, events, and phases of life. There are some defaults you can use as a starting point, but milestones are flexible and customizable. It’s a good idea to spend a little time thinking about the key events and transitions you want to plan for.
Milestones can be anything from retirement or purchasing a home, to reaching your personal definition of financial independence, having kids, moving to a new state or country, etc. They can even have tax consequences.
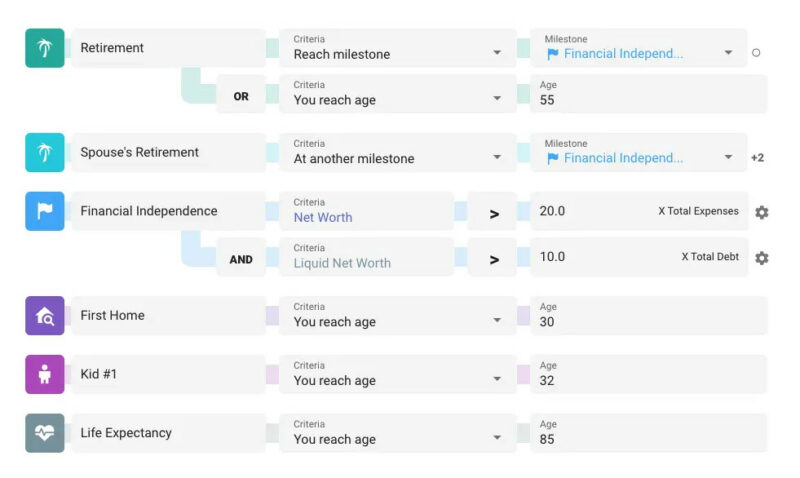
Where things get interesting is when you add multiple income streams, expenses, asset purchases/sales, and cash-flow priorities, and then use your milestones as dynamic bindings to control when everything starts and stops. You can even click and drag the slider for one of your milestones and see everything updated in real-time as you move the big decisions around in the timeline.
But we’re getting ahead of ourselves. Let’s do a little modeling!
Let’s make a plan
So you have heard about the surprising power of investing early… how about we see that in action!
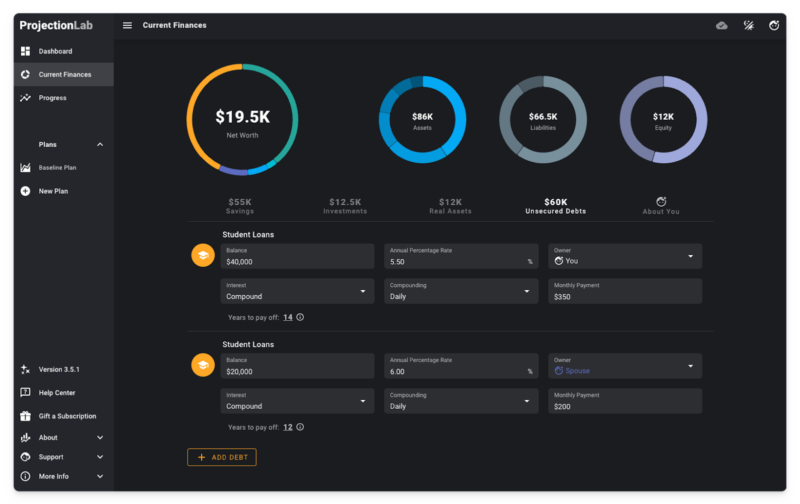
We will pretend to be an early career married couple in their mid-twenties with some student loans, currently renting in an HCOL city, and trying to figure out what the future might hold.
Within the Current Finances page, here is what we’ll start with. Some cash savings, two vehicles, a couple small investments, and student loans. I will also take the liberty to point out that there is a dark mode, if you are into that 😎
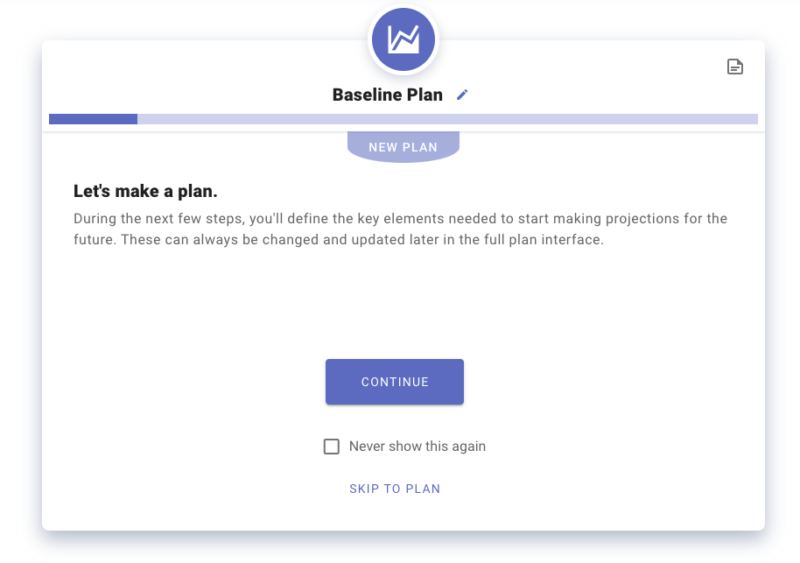
To make projections for the future, we will create a plan, define a few assumptions, add milestones, income streams, expenses, and cash-flow priorities, pick a tax configuration, and choose a drawdown sequence.
In the interest of time, we will gloss over that setup process.
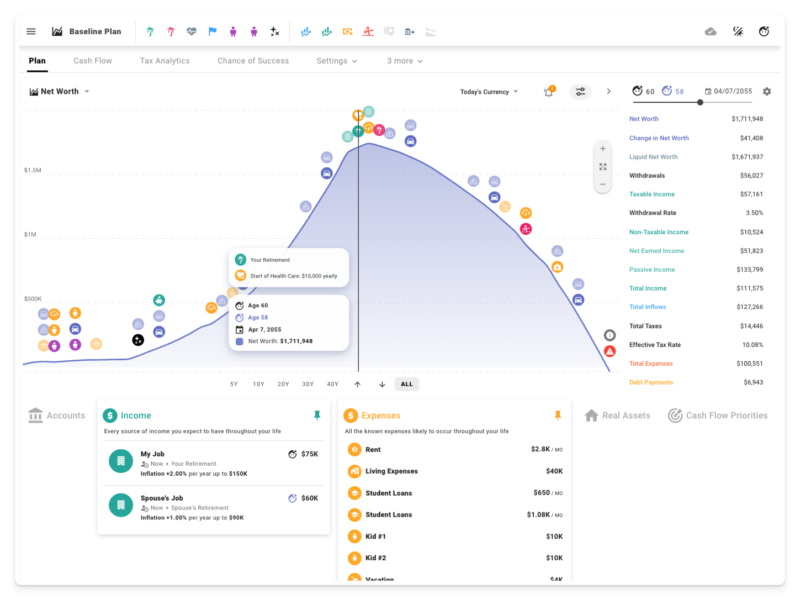
To keep things approachable, how about a baseline scenario like this: simple career progression, two kids, some investment contributions, retirement at 60, buying a car every 8 years, medical expenses increasing later in life, and unexpected emergencies every 15 years that scale up a bit each time.
For now, we will also assume a 5.34% real rate of return. But if you are tired of reading posts about deterministic planning using fixed rates, feel free to skip to the Monte Carlo section below. 😉
Start investing early
What would happen if we waited a while to start saving and investing?
To model this, let’s create a milestone to represent the point in time when we start getting our act together.

And then set up some cash-flow priorities that will kick in when that milestone occurs:
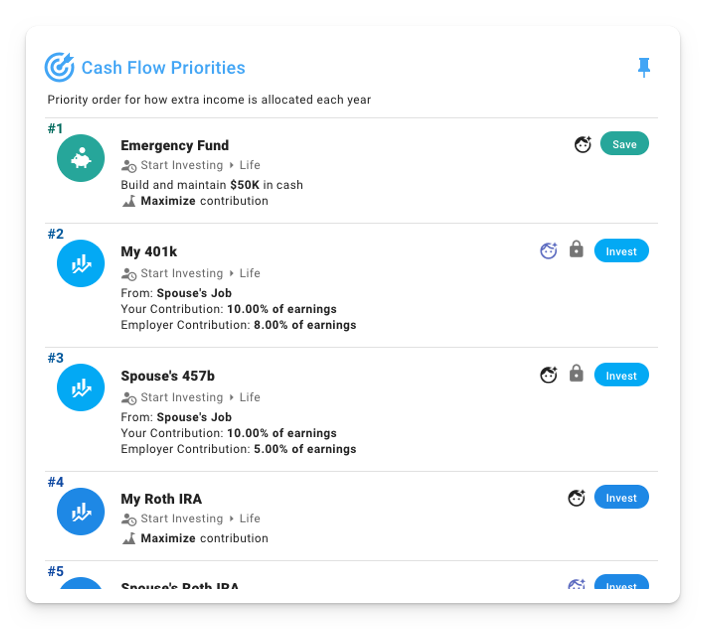
As readers of Wallet Hacks, you already know that fees matter, a lot. But for now, let’s say we missed that memo and chose funds with a hefty 1.00% expense ratio.
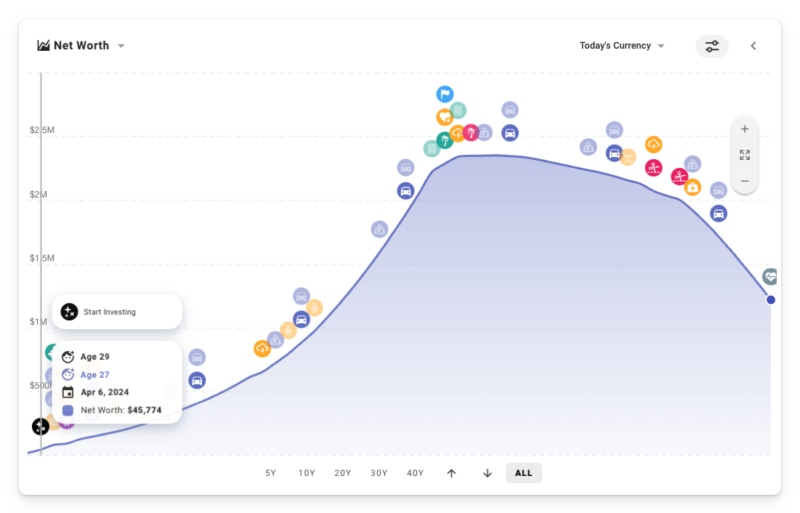
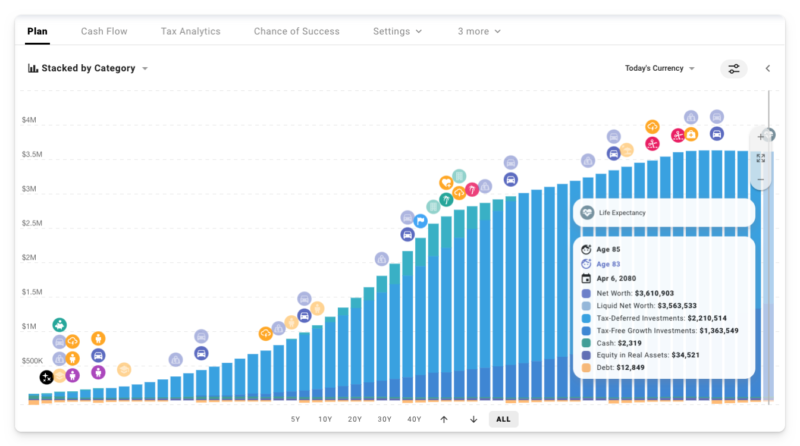
Assuming we start investing at ages 37 and 39, here is how things go.
Uh-oh. Bankrupt in our 80s. 😬
But what if we started investing right away instead? Even though those early years are a bit lean from a savings rate perspective, getting the snowball rolling early makes a huge difference. This time, we leave a legacy of over $1M. In today’s currency, too!
And what if we ditch those high-cost funds for some low-cost, broad-based index funds? Does it really matter if we cut the 1% fees down to 0.04% instead?
It sure does! To the tune of a couple million dollars by the end 😱
See where your money is going
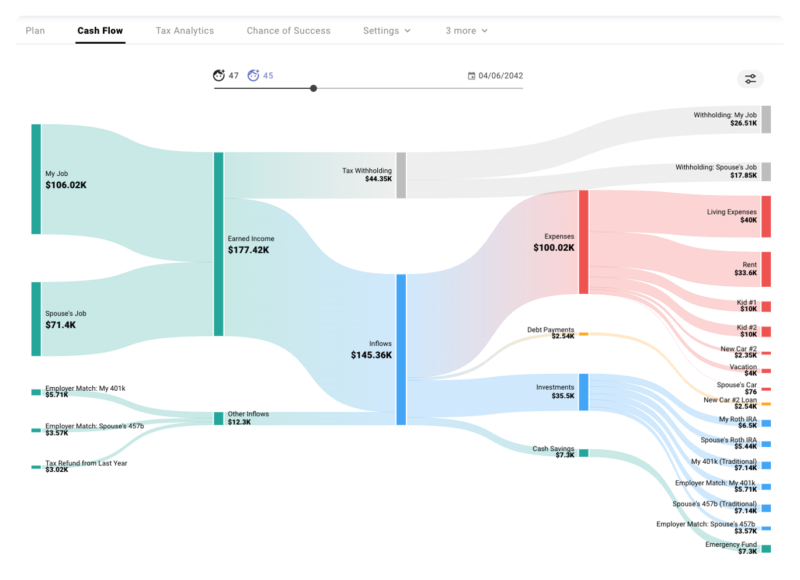
So, what is actually happening in some of these years? The sankey chart in the Cash Flow tab illustrates how money flows in and out during each simulated year.
We can see how earned income (less withholding) flows into the plan, along with employer match/contributions to tax-advantaged accounts, and how these inflows are used to pay for expenses, service debt, contribute towards investments, and build an emergency fund based on our ordered cash flow priorities.
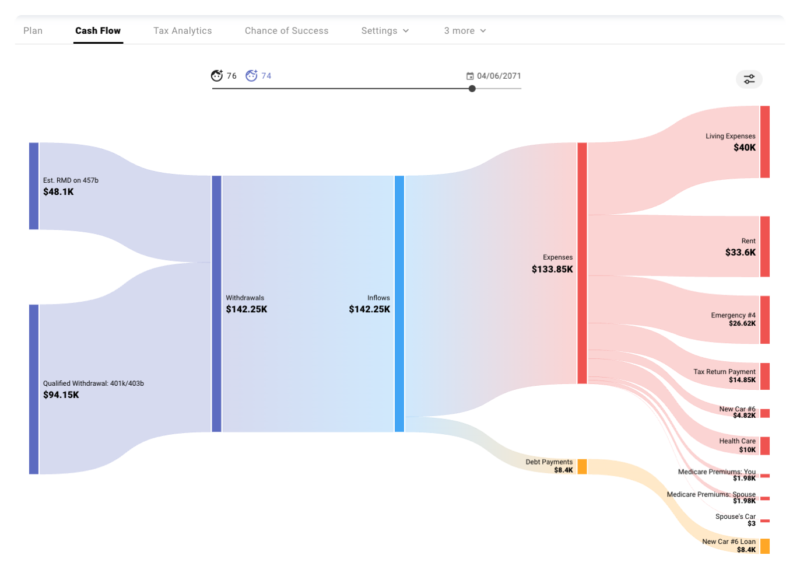
In later years during the drawdown phase, we see some estimated RMDs and additional qualified withdrawals used to pay for expenses.
Estimate your future taxes
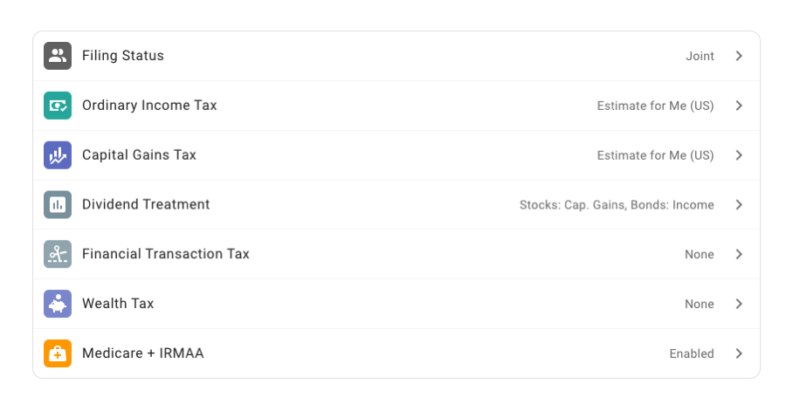
We can also use the tax analytics module to drill down on specific years and examine how the various kinds of estimated taxes and their underlying brackets apply to each income type.
Within our plan’s tax settings, we have enabled US tax estimation:
And here is a look at our projected future income and the effective tax brackets that apply to each type.
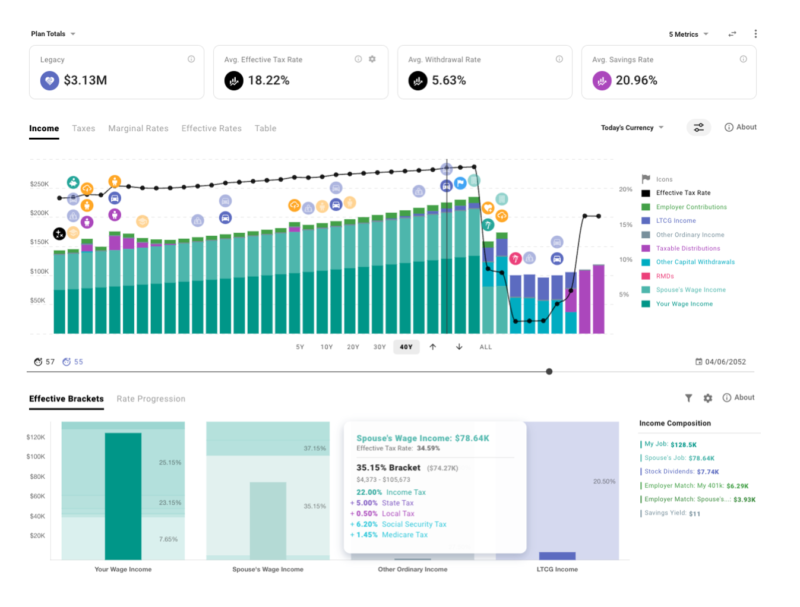
You can plot marginal and effective tax rates over time, and also see how extra hypothetical dollars of each kind would be taxed.
Estimate your chance of success
Now that we are investing early in low-cost index funds, is there a chance we could actually retire earlier? Let’s try shaving 5 years off the retirement timeline 🏝️
But wait… so far we have just been using static rate of return assumptions, right? That is true. In the deterministic planning mode, we have been assuming a consistent 5.34% real rate of return.
Does the real world work like that? It does not!
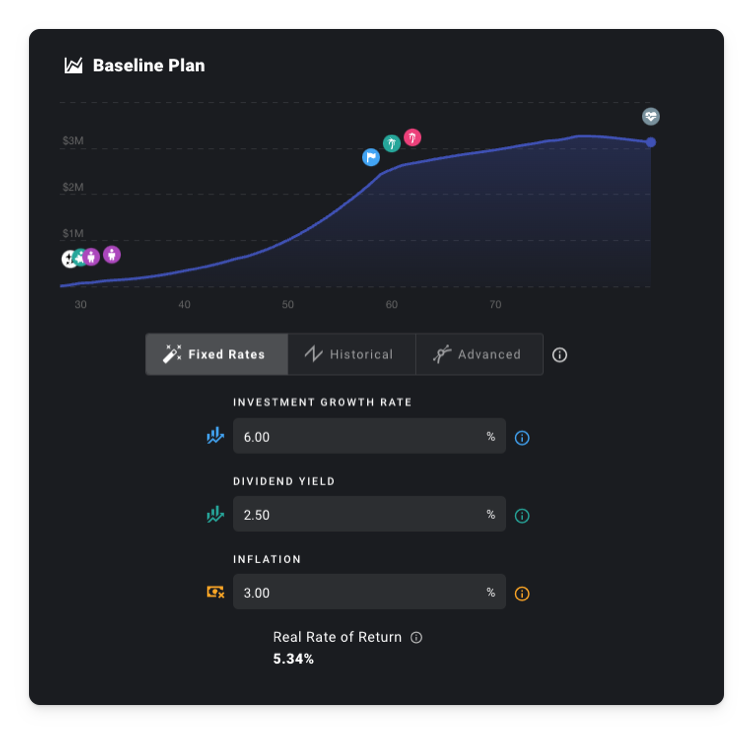
We could choose to explore a specific historical sequence, or create custom return/inflation curves to model a scenario of our own design.
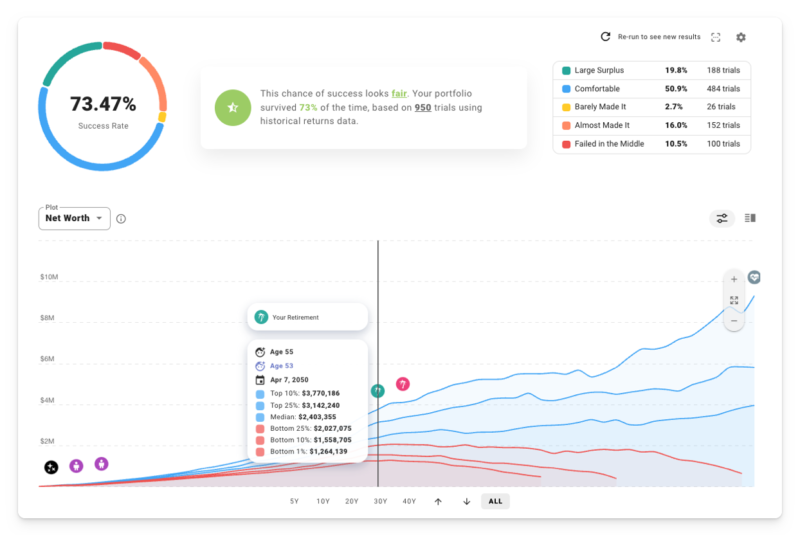
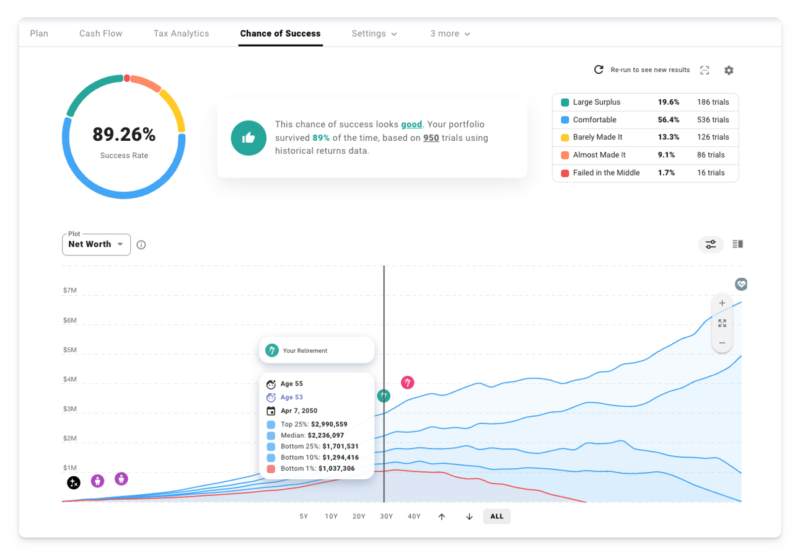
But what if we really want to battle-test this plan against the kind of market volatility you can expect in the real world? What if we want better intuition about the spectrum of possible outcomes? Time to visit the Chance of Success tab and run some Monte Carlo simulations!
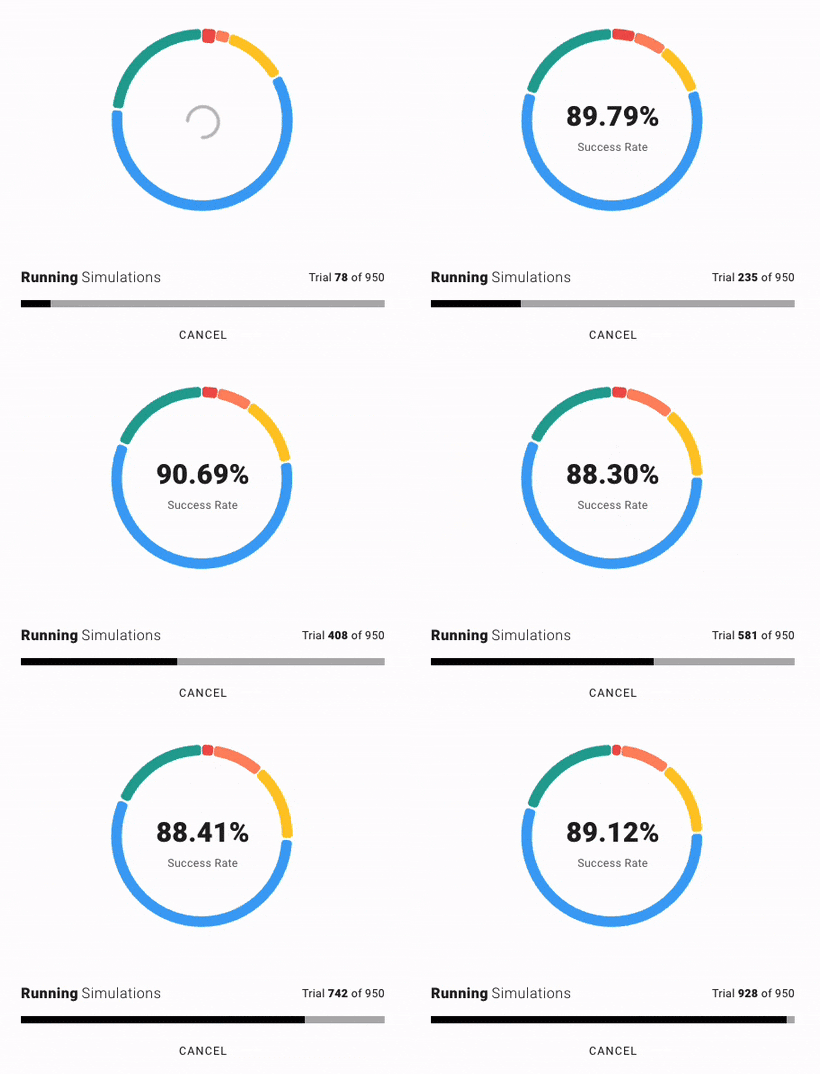
Based on 950 trials using historical S&P 500 returns, dividends, and US inflation data, here is how things are looking with our new retirement age of 55.
Don’t overspend on your home
So what is missing right now? Well, maybe we don’t want to rent forever. Maybe we want a nice home in an area we like for the two kids to grow up in.
And maybe we don’t know any of the rules of thumb from the money ratios article 🤦♂️
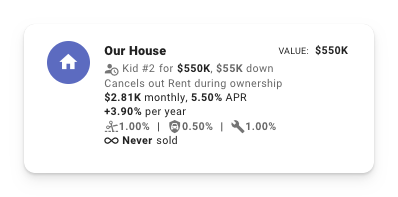
Let’s see what happens if we purchase a house around the time Kid #2 arrives for about 4x our annual income.
Here is the impact on our chance of success:
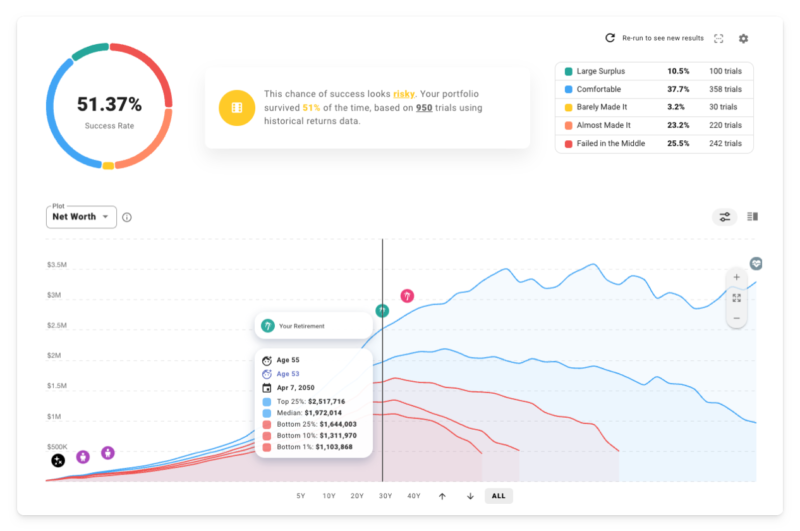
Wait a second! What happened to the American dream of homeownership? What is going on here?!
Back in the deterministic planning view, we can see that the total cost of ownership for this new home has driven up our spending considerably during the crucial early years.
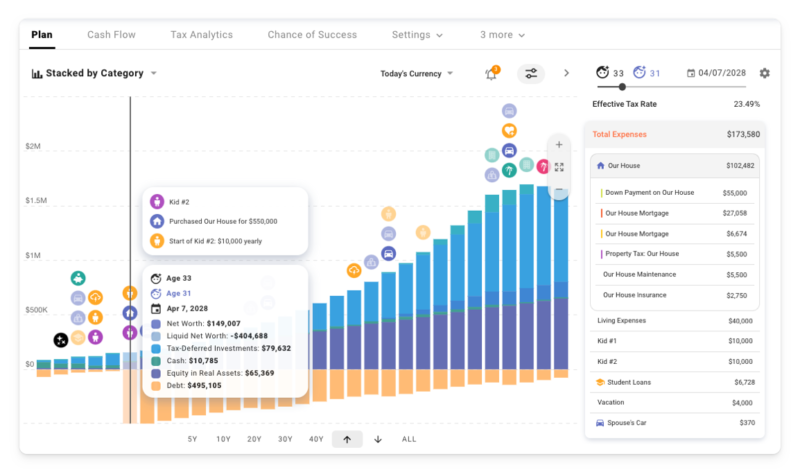
We do build equity in the home over time as we pay down the mortgage, but at retirement we end up with a lower net worth than our original plan, and significantly less in liquid assets available to draw down during our golden years.
Okay, so maybe getting the biggest house we can qualify for is not the right way to approach this 😅
What if we purchase a home for 2.5x our income instead?
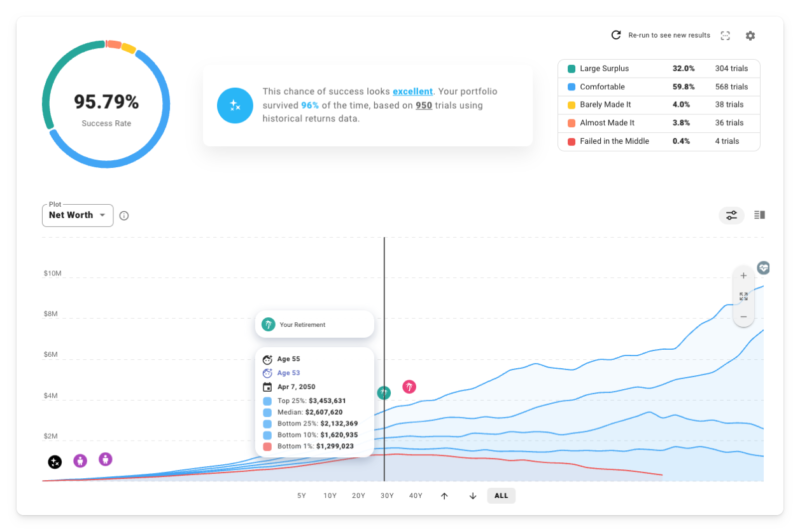
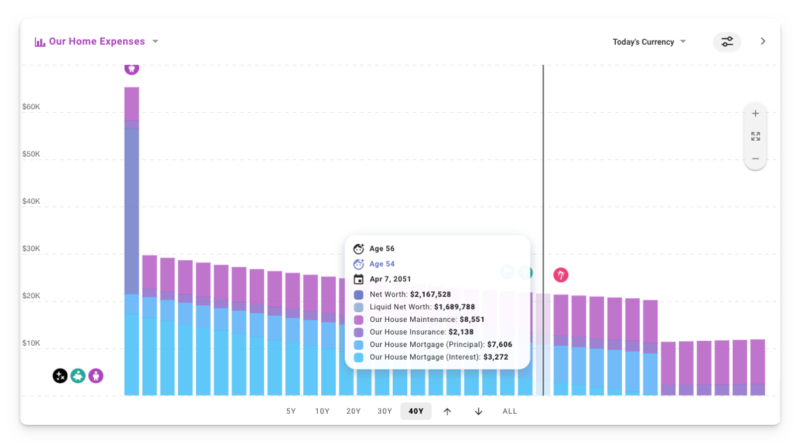
Nice! The best outcome yet. Going with the more modest home locks in a more reasonable yearly spend. And those expenses actually decrease over time in today’s currency! (i.e. adjusted for inflation)
We can see that at work back in the deterministic view by creating a custom stacked bar plot and filtering to show only housing expenses.
In contrast, the original plan where we rented the whole time had rent pegged to inflation, so it remained constant over time in today’s currency.
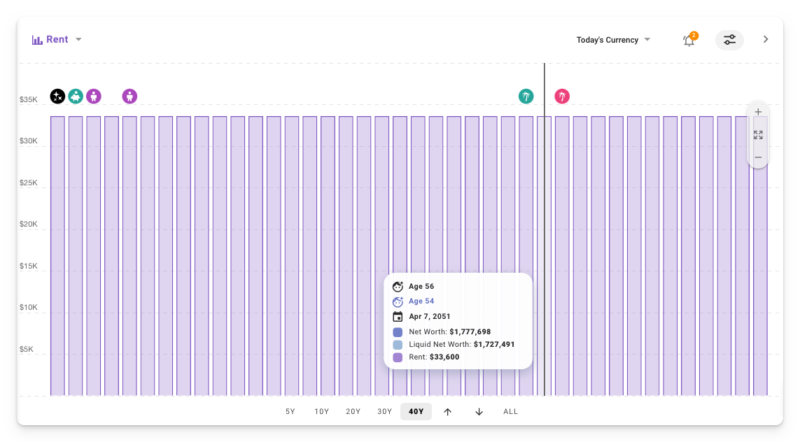
So is it better to rent vs own? As with most things, the answer is: “it depends” 😜
Want to learn more?
At this point, we have only scratched the surface of what you can model in ProjectionLab, but I am starting to feel bad about all the screenshots and GIFs Jim will have to wrangle into the final post.
To learn more, here are some links you can check out:
- The tool: https://projectionlab.com
- Podcast appearance on The FI Show: http://thefishow.com/kyle
- A video review by Rob Berger
You can run basic simulations for free with the sandbox version, and you can use this coupon code for 10% off the premium version: WALLETHACKS-10 🎉


