Investment advisors often recommend holding a large part of your stock portfolio in the S&P 500 index, and for a good reason. The index has been steadily outperforming the rest of the market for over a decade.
The easiest way to hold the S&P 500 is through index funds. Since they are designed to match the index’s performance closely, they represent the best way to take advantage of the S&P 500 with virtually any amount of money.
Two of the top S&P 500 index funds are the Vanguard S&P 500 ETF (VOO) and the SPDR S&P 500 ETF Trust (SPY). Both funds perform a similar function, so which one should you buy?
The differences between the two exchange-traded funds are very slight. Either will get the job done if you’re looking to match the performance of the S&P 500. But it might come down to personal preference for which you may choose.
Table of Contents
VOO vs. SPY: How Each One Works
Vanguard S&P 500 ETF (VOO) and the SPDR S&P 500 ETF Trust (SPY) are designed with the same goal in mind – to track the performance of the S&P 500 index, which comprises the 500 largest publicly traded companies in the United States. You’ll benefit from the stock performance of the top companies in the country. And since the index covers all major industries, you’ll be diversified across multiple sectors. International stocks, of course, aren’t included in the S&P 500 as it’s the U.S. only.
Each fund is issued by a major fund family. VOO belongs to the very popular Vanguard organization, while SPY is part of State Street Global Advisors (SSGA). Each represents one of the most prominent fund families globally, giving you the ability to hold multiple funds under the same roof. And because they’re so popular, they’re available from nearly any broker in the industry.
VOO vs. SPY: The Direct Comparison
The Basics
The table below provides a side-by-side comparison of the basic features of VOO and SPY. As you’ll notice, there are more similarities than differences between the two ETFs.
| Fund / Feature | VOO | SPY |
| Asset Class | Domestic Stock – General | Domestic Stock – General |
| Category | Large Blend | Large Blend |
| When Launched | 09/07/2010 | 01/22/1993 |
| Expense Ratio | 0.03% | 0.0945% |
| Market Price (as of 5/25/2022) | $365.20 | $397.37 |
| 52-week High / Low Price | $358.04 / $439.25 | $380.54 / $479.98 |
| Total Net Assets | $760.1 billion | $358.7 billion |
| Number of Stocks | 505 | 505 |
| Dividend Distribution | Quarterly | Quarterly |
Portfolios
The industry distribution of the VOO is as follows: information technology (27.4%), healthcare (14.2%), consumer discretionary (11.5%), financials (10.9%), and communication services (8.6%).
Here are the top ten holdings of VOO (as of 10/5/2022):
- Apple Inc.
- Microsoft Corp
- Amazon.com Inc.
- Tesla Inc.
- Alphabet Inc. Class A
- Alphabet Inc. Class C
- Berkshire Hathaway Inc. Class B
- UnitedHealth Group Inc.
- Johnson & Johnson
- Exxon Mobil Corp.
The industry allocation of SPY is as follows: information technology (26.87%), healthcare (14.81%), financials (11.20%), consumer discretionary (10.36%), and communication services (8.97%). This distribution roughly parallels VOO, though it isn’t identical.
Below, SPY’s top ten holdings represent 29.0% of the overall net assets of the fund:
- Apple Inc.
- Microsoft Corp
- Amazon.com Inc.
- Tesla Inc.
- Alphabet Inc., Class A
- Alphabet Inc., Class C
- Berkshire Hathaway Inc. Class B
- UnitedHealth Group Inc.
- Johnson & Johnson
- Exxon Mobil Corp.
Right now, there are no differences in the names of the top ten holdings though weighting is slightly different. Sometimes the names differ only because of the shuffling that likely happens in those just out of the top ten. In the past, there were some differences like VOO included NVIDIA, while SPY didn’t (though SPY likely included NVIDIA outside its top 10 holdings.)
These are likely the result of tracking error at the time we looked – since they are aiming to mirror the index.
Otherwise, as you can see from the summary table above, each fund holds an identical 505 stocks and tracks the performance of the S&P 500 index.
Fund Performance
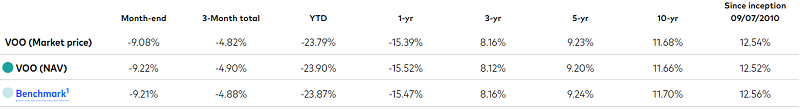
Below are screenshots of the 1-year, 3-year, 5-year, 10-year, and since inception performances of both funds, according to Vanguard and SSGA, but take them with a grain of salt because they are not the same time periods.
VOO is accurate through 9/30/2022 and SPY is accurate through 8/31/2022.
VOO:
SPY:
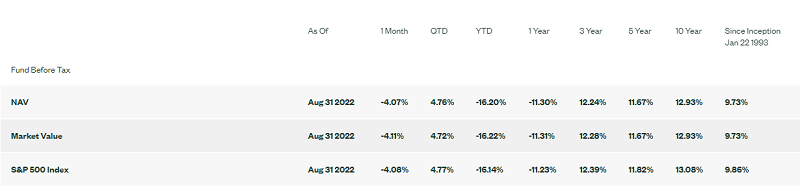
If we could overlay the two screenshots, the performance for each period would be almost identical if the time periods were the same. Since they are not, we won’t be doing a side by side comparison as we normally do.
In the past, when we’ve done this, there was a slight difference and VOO outperformed the SPY by only a few basis points.
Much of this can be explained by the difference in the expense ratio for each fund. While VOO has an expense ratio of 0.03%, SPY is 0.0945%. That means VOO has an annual advantage of 0.0645% on the expense ratio, which makes up slightly more than half the difference in annual performance.
VOO vs. SPY: Is One Better than the Other?
Usually, when comparing two funds that perform the same function, the differences between the two funds are insignificant and more personal preference than anything else.
You can say this of the VOO and the SPY to a certain degree. Each is tied to the S&P 500 index, holds 505 stocks, and maintains nearly matching industry sector allocations. And as S&P 500 index-based funds, neither have any significant exposure to international markets.
VOO vs SPY: And the Winner is…
If I have to pick a winner, it would be VOO, based purely on performance.
The performance is higher for the most recent 12 months, but there’s a consistent 0.12% performance advantage over the most recent 3-year, 5-year, and 10-year time frames.
That kind of performance edge can make a difference when you hold a fund in your portfolio for over 20 or 30 years. And since the S&P 500 is so popular among investors, that’s what you should expect to do. Depending on your portfolio size, a small performance advantage can add up to thousands of dollars over the years.
Investors seem to share that sentiment. Even though SPY has been around for about 17 years longer than VOO, VOO nonetheless has twice the volume of assets under management as SPY.
Some of it has to do with the lower management expense ratio of the VOO, But even when you discount for the MER, VOO still has a slight performance advantage over SPY. To find out how VOO stacks up against a total stock market ETF, check out our VOO vs. VTI comparison.